
New course
Power BI
Learning Power BI equips individuals with the ability to transform raw data into meaningful insights through interactive visualizations and reports, ...
Show more
7
Students
enrolled
- Description
- Curriculum
Power BI is a powerful business analytics tool developed by Microsoft. It allows users to visualize and share insights from their organization’s data through interactive reports and dashboards. Key features include data connectivity, transformation, visualization, and collaboration capabilities, making it popular for data analysis and decision-making.
Key Features and Capabilities:
-
Data Connectivity and Transformation:
- Connectivity: Access data from various sources such as Excel spreadsheets, databases (SQL Server, MySQL), cloud services (Azure, Salesforce), and more.
- Data Transformation: Clean, shape, and model data using Power Query Editor to prepare it for analysis.
-
Visualization and Exploration:
- Interactive Reports: Create visually appealing reports with charts, graphs, maps, and tables to explore data trends and patterns.
- Dashboards: Combine multiple reports into a single dashboard for consolidated insights.
-
Data Analysis Expressions (DAX):
- Formula Language: Use DAX to create calculated columns and measures for advanced calculations and business logic within Power BI reports.
-
Integration and Collaboration:
- Microsoft Ecosystem: Seamlessly integrates with other Microsoft products like Excel, SharePoint, and Teams.
- Sharing and Collaboration: Publish reports to the Power BI Service for sharing with colleagues and stakeholders, with options for collaboration and real-time updates.
-
Security and Compliance:
- Role-Based Security: Control access to data and reports based on user roles and permissions.
- Data Governance: Ensure compliance with organizational data policies and regulations.
Benefits of Power BI:
- User-Friendly Interface: Designed for non-technical users to easily create and interact with data visualizations.
- Scalability: Suitable for small teams to large enterprises, accommodating growing data needs.
- Real-Time Insights: Enables real-time data monitoring and analysis for proactive decision-making.
Applications:
- Business Intelligence: Analyze sales performance, operational metrics, and financial data.
- Data Visualization: Create interactive dashboards for monitoring key performance indicators (KPIs).
- Predictive Analytics: Use advanced analytics capabilities for forecasting and trend analysis.
Power BI empowers organizations to leverage their data effectively, driving data-driven decisions and improving business outcomes across various industries
UP & RUNNING WITH MICROSOFT POWER BI DESKTOP
INTRODUCING POWER BI
-
5
 MEET POWER BI
MEET POWER BI
-
6
MEET POWER BI
MEET POWER BI
-
7
WHY POWER BI?
WHY POWER BI?
-
8
EXCEL VS. POWER BI
EXCEL VS. POWER BI
-
9
INSTALLING POWER BI DESKTOP
INSTALLING POWER BI DESKTOP
-
10
POWER BI SETTINGS
POWER BI SETTINGS
-
11
POWER BI WORKFLOW
POWER BI WORKFLOW
-
12
POWER BI WORKFLOW
POWER BI WORKFLOW
-
13
POWER BI WORKFLOW
POWER BI WORKFLOW
-
14
POWER BI WORKFLOW
POWER BI WORKFLOW
-
15
POWER BI WORKFLOW
POWER BI WORKFLOW
-
16
HELPFUL RESOURCES
HELPFUL RESOURCES
-
17
MONTHLY UPDATES
MONTHLY UPDATES
CONNECTING & SHAPING DATA
-
18
CONNECTING & SHAPING DATA
CONNECTING & SHAPING DATA
-
19
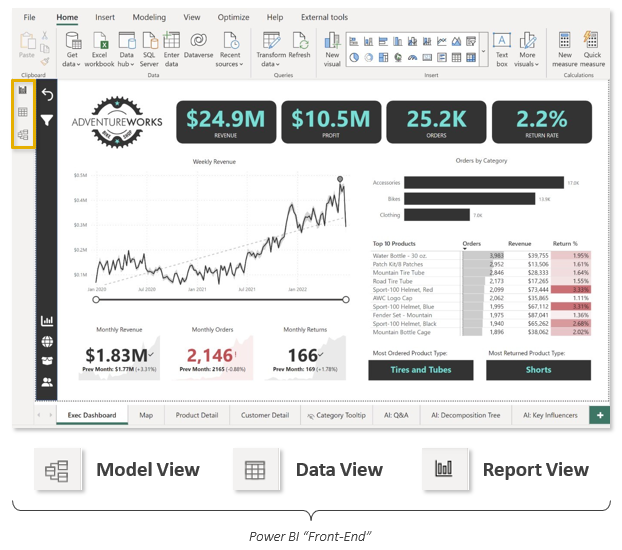
FRONT-END VS. BACK-END
FRONT-END VS. BACK-END
-
20
TYPES OF DATA CONNECTORS
TYPES OF DATA CONNECTORS
-
21
POWER QUERY EDITOR
POWER QUERY EDITOR
-
22
QUERY EDITING TOOLS
QUERY EDITING TOOLSS
-
23
BASIC TABLE TRANSFORMATIONS
BASIC TABLE TRANSFORMATIONS
-
24
 ASSIGNMENT: TABLE TRANSFORMATIONS
 -
25
SOLUTION: TABLE TRANSFORMATIONS
SOLUTION: TABLE TRANSFORMATIONS
-
26
PRO TIP: STORAGE & CONNECTION MODES
PRO TIP: STORAGE & CONNECTION MODES
-
27
CONNECTING TO A DATABASE
CONNECTING TO A DATABASE
-
28
EXTRACTING DATA FROM THE WEB
EXTRACTING DATA FROM THE WEB
-
29
DATA PROFILING: COLUMN QUALITY
DATA PROFILING: COLUMN QUALITY
-
30
DATA PROFILING: COLUMN DISTRIBUTION
DATA PROFILING: COLUMN DISTRIBUTION
-
31
DATA PROFILING: COLUMN PROFILE
DATA PROFILING: COLUMN PROFILE
-
32
TEXT TOOLS
TEXT TOOLS
-
33
ASSIGNMENT: TEXT TOOLS
-
34
SOLUTION: TEXT TOOLS
SOLUTION: TEXT TOOLS
-
35
NUMERICAL TOOLS
NUMERICAL TOOLS
-
36
ASSIGNMENT: NUMERICAL TOOLS
-
37
SOLUTION: NUMERICAL TOOLS
SOLUTION: NUMERICAL TOOLS
-
38
DATE & TIME TOOLS
DATE & TIME TOOLS
-
39
DATE & TIME TOOLS
-
40
CREATING A CALENDAR TABLE
-
41
CHANGE TYPE WITH LOCALE
-
42
CHANGE TYPE WITH LOCALE
-
43
PRO TIP: ROLLING CALENDARS
-
44
PRO TIP: ROLLING CALENDARS
-
45
ASSIGNMENT: CALENDAR TABLES
-
46
SOLUTION: CALENDAR TABLES
-
47
INDEX COLUMNS
-
48
CONDITIONAL COLUMNS
-
49
CALCULATED COLUMN BEST PRACTICES
-
50
GROUPING & AGGREGATING
-
51
GROUPING & AGGREGATING
-
52
PIVOTING & UNPIVOTING
-
53
MERGING QUERIES
-
54
PRO TIP: APPENDING FILES FROM A FOLDER
-
55
DATA SOURCE SETTINGS
-
56
PRO TIP: DATA SOURCE PARAMETERS
-
57
REFRESHING QUERIES
-
58
PRO TIP: IMPORTING EXCEL MODELS
-
59
POWER QUERY BEST PRACTICES
-
60
APPENDING QUERIES
CREATING A DATA MODEL
-
61
CREATING A DATA MODEL
-
62
WHAT IS A DATA MODEL?
-
63
WHAT IS A DATA MODEL?
-
64
DATABASE NORMALIZATION
-
65
FACT & DIMENSION TABLES
-
66
PRIMARY & FOREIGN KEYS
-
67
RELATIONSHIPS VS. MERGED TABLES
-
68
THE MODEL VIEW
-
69
CREATING TABLE RELATIONSHIPS
-
70
MANAGING & EDITING RELATIONSHIPS
-
71
STAR & SNOWFLAKE SCHEMAS
-
72
ASSIGNMENT: TABLE RELATIONSHIPS
-
73
SOLUTION: TABLE RELATIONSHIPS
-
74
PRO TIP: ACTIVE & INACTIVE RELATIONSHIPS
-
75
PRO TIP: ACTIVE & INACTIVE RELATIONSHIPS
-
76
RELATIONSHIP CARDINALITY
-
77
EXAMPLE: ONE-TO-ONE CARDINALITY
-
78
EXAMPLE: MANY-TO-MANY CARDINALITY
-
79
CONNECTING MULTIPLE FACT TABLES
-
80
FILTER CONTEXT & FLOW
-
81
EXAMPLE: FILTER FLOW
-
82
BI-DIRECTIONAL FILTERS
-
83
EXAMPLE: BI-DIRECTIONAL FILTERS
-
84
AMBIGUITY
-
85
HIDING FIELDS
-
86
ASSIGNMENT: FILTER FLOW
-
87
SOLUTION: FILTER FLOW
-
88
PRO TIP: MODEL LAYOUTS
-
89
DATA FORMATS & CATEGORIES
-
90
HIERARCHIES
-
91
ASSIGNMENT: HIERARCHIES
-
92
SOLUTION: HIERARCHIES
-
93
DATA MODEL BEST PRACTICES
CALCULATED FIELDS WITH DAX
-
94
CALCULATED FIELDS WITH DAX
-
95
MEET DAX
-
96
M VS. DAX
-
97
CALCULATED COLUMNS
-
98
EXAMPLE: CALCULATED COLUMNS
-
99
DAX MEASURES
-
100
IMPLICIT VS. EXPLICIT MEASURES
-
101
QUICK MEASURES
-
102
RECAP: CALCULATED COLUMNS VS. MEASURES
-
103
PRO TIP: MEASURE TABLES
-
104
FILTER CONTEXT
-
105
EXAMPLE: FILTER CONTEXT
-
106
STEP-BY-STEP MEASURE CALCULATION
-
107
DAX SYNTAX
-
108
DAX OPERATORS
-
109
COMMON FUNCTION CATEGORIES
-
110
BASIC MATH & STATS FUNCTIONS
-
111
ASSIGNMENT: MATH & STATS
-
112
SOLUTION: MATH & STATS
-
113
BASIC LOGICAL FUNCTIONS
-
114
SWITCH
-
115
ASSIGNMENT: LOGICAL FUNCTIONS
-
116
SOLUTION: TEXT
-
117
BASIC DATE & TIME FUNCTIONS
-
118
ASSIGNMENT: DATE & TIME
-
119
SOLUTION: DATE & TIME
-
120
RELATED
-
121
CALCULATE
-
122
EXAMPLE: CALCULATE
-
123
EXAMPLE: CALCULATE
-
124
DAX MEASURE TOTALS
-
125
ASSIGNMENT: CALCULATE
-
126
SOLUTION: CALCULATE
-
127
SOLUTION: CALCULATE
-
128
ALL
-
129
ASSIGNMENT: CALCULATE & ALL
-
130
SOLUTION: CALCULATE & ALL
-
131
FILTER
-
132
ITERATOR FUNCTIONS
-
133
ASSIGNMENT: ITERATORS
-
134
SOLUTION: ITERATORS
-
135
TIME INTELLIGENCE
-
136
ASSIGNMENT: TIME INTELLIGENCE
-
137
SOLUTION: TIME INTELLIGENCE
-
138
DAX BEST PRACTICES
-
139
COUNTING FUNCTIONS
VISUALIZING DATA
-
140
VISUALIZING DATA
-
141
THREE KEY QUESTIONS
-
142
THREE KEY QUESTIONS
-
143
THREE KEY QUESTIONS
-
144
THREE KEY QUESTIONS
-
145
ANALYTICS DASHBOARDS
-
146
DASHBOARD DESIGN FRAMEWORK
-
147
THE REPORT VIEW
-
148
ASSIGNMENT: CARDS
-
149
SOLUTION: CARDS
-
150
BUILDING & FORMATTING CHARTS
-
151
BUILDING & FORMATTING CHARTS
-
152
ASSIGNMENT: LINE CHARTS
-
153
SOLUTION: LINE CHARTS
-
154
FILTERING OPTIONS
-
155
ASSIGNMENT: DONUT CHARTS
-
156
SOLUTION: DONUT CHARTS
-
157
CONDITIONAL FORMATTING
-
158
ASSIGNMENT: TABLES
-
159
SOLUTION: TABLES
-
160
ASSIGNMENT: TOP N TEXT CARDS
-
161
SOLUTION: TOP N TEXT CARDS
-
162
MAP VISUALS
-
163
SLICERS
-
164
ASSIGNMENT: SLICERS
-
165
SOLUTION: SLICERS
-
166
DRILL UP & DRILL DOWN
-
167
ASSIGNMENT: DRILL DOWN
-
168
SOLUTION: DRILL DOWN
-
169
DRILL THROUGH FILTERS
-
170
REPORT INTERACTIONS
-
171
ASSIGNMENT: REPORT INTERACTIONS
-
172
SOLUTION: REPORT INTERACTIONS
-
173
BOOKMARKS
-
174
ASSIGNMENT: BOOKMARKS
-
175
SOLUTION: BOOKMARKS
-
176
PARAMETERS
-
177
EXAMPLE: FIELDS PARAMETER
-
178
ASSIGNMENT: FIELDS PARAMETERS
-
179
SOLUTION: FIELDS PARAMETERS
-
180
PRO TIP: CUSTOM TOOLTIPS
-
181
IMPORTING CUSTOM VISUALS
-
182
MANAGING & VIEWING ROLES
-
183
MOBILE LAYOUT
-
184
DATA VISUALIZATION BEST PRACTICES
-
185
EXAMPLE: NUMERIC RANGE PARAMETER
ARTIFICIAL INTELLIGENCE


