Power BI
Power BI is a powerful and versatile business analytics tool developed by Microsoft. In the course, you’ll delve into this comprehensive platform designed to empower users in extracting insights from their data. Through a series of hands-on tutorials and lectures, you’ll navigate the various components of Power BI, gaining proficiency in data visualization, analysis, and […]
UP & RUNNING WITH MICROSOFT POWER BI DESKTOP
INTRODUCING POWER BI
-
5
 MEET POWER BI
MEET POWER BI
-
6
MEET POWER BI
MEET POWER BI
-
7
WHY POWER BI?
WHY POWER BI?
-
8
EXCEL VS. POWER BI
EXCEL VS. POWER BI
-
9
INSTALLING POWER BI DESKTOP
INSTALLING POWER BI DESKTOP
-
10
POWER BI SETTINGS
POWER BI SETTINGS
-
11
POWER BI WORKFLOW
POWER BI WORKFLOW
-
12
POWER BI WORKFLOW
POWER BI WORKFLOW
-
13
POWER BI WORKFLOW
POWER BI WORKFLOW
-
14
POWER BI WORKFLOW
POWER BI WORKFLOW
-
15
POWER BI WORKFLOW
POWER BI WORKFLOW
-
16
HELPFUL RESOURCES
HELPFUL RESOURCES
-
17
MONTHLY UPDATES
MONTHLY UPDATES
CONNECTING & SHAPING DATA
-
18
CONNECTING & SHAPING DATA
CONNECTING & SHAPING DATA
-
19
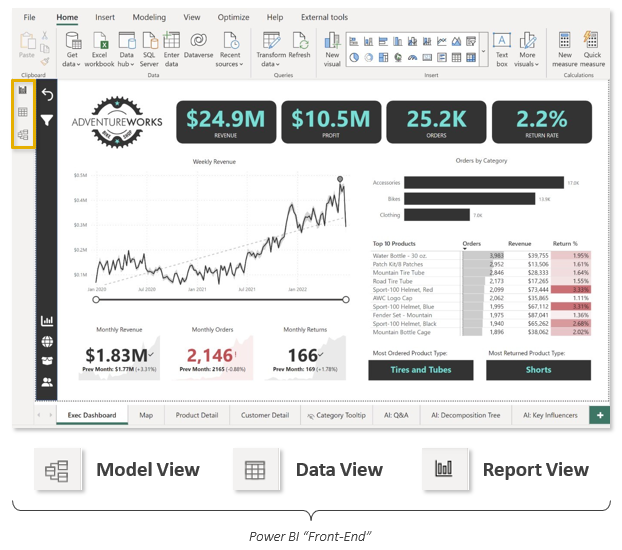
FRONT-END VS. BACK-END
FRONT-END VS. BACK-END
-
20
TYPES OF DATA CONNECTORS
TYPES OF DATA CONNECTORS
-
21
POWER QUERY EDITOR
POWER QUERY EDITOR
-
22
QUERY EDITING TOOLS
QUERY EDITING TOOLSS
-
23
BASIC TABLE TRANSFORMATIONS
BASIC TABLE TRANSFORMATIONS
-
24
 ASSIGNMENT: TABLE TRANSFORMATIONS
 -
25
SOLUTION: TABLE TRANSFORMATIONS
SOLUTION: TABLE TRANSFORMATIONS
-
26
PRO TIP: STORAGE & CONNECTION MODES
PRO TIP: STORAGE & CONNECTION MODES
-
27
CONNECTING TO A DATABASE
CONNECTING TO A DATABASE
-
28
EXTRACTING DATA FROM THE WEB
EXTRACTING DATA FROM THE WEB
-
29
DATA PROFILING: COLUMN QUALITY
DATA PROFILING: COLUMN QUALITY
-
30
DATA PROFILING: COLUMN DISTRIBUTION
DATA PROFILING: COLUMN DISTRIBUTION
-
31
DATA PROFILING: COLUMN PROFILE
DATA PROFILING: COLUMN PROFILE
-
32
TEXT TOOLS
TEXT TOOLS
-
33
ASSIGNMENT: TEXT TOOLS
-
34
SOLUTION: TEXT TOOLS
SOLUTION: TEXT TOOLS
-
35
NUMERICAL TOOLS
NUMERICAL TOOLS
-
36
ASSIGNMENT: NUMERICAL TOOLS
-
37
SOLUTION: NUMERICAL TOOLS
SOLUTION: NUMERICAL TOOLS
-
38
DATE & TIME TOOLS
DATE & TIME TOOLS
-
39
DATE & TIME TOOLS
-
40
CREATING A CALENDAR TABLE
-
41
CHANGE TYPE WITH LOCALE
-
42
CHANGE TYPE WITH LOCALE
-
43
PRO TIP: ROLLING CALENDARS
-
44
PRO TIP: ROLLING CALENDARS
-
45
ASSIGNMENT: CALENDAR TABLES
-
46
SOLUTION: CALENDAR TABLES
-
47
INDEX COLUMNS
-
48
CONDITIONAL COLUMNS
-
49
CALCULATED COLUMN BEST PRACTICES
-
50
GROUPING & AGGREGATING
-
51
GROUPING & AGGREGATING
-
52
PIVOTING & UNPIVOTING
-
53
MERGING QUERIES
-
54
APPENDING QUERIES
-
55
PRO TIP: APPENDING FILES FROM A FOLDER
-
56
DATA SOURCE SETTINGS
-
57
PRO TIP: DATA SOURCE PARAMETERS
-
58
REFRESHING QUERIES
-
59
PRO TIP: IMPORTING EXCEL MODELS
-
60
POWER QUERY BEST PRACTICES
CREATING A DATA MODEL
-
61
CREATING A DATA MODEL
-
62
WHAT IS A DATA MODEL?
-
63
WHAT IS A DATA MODEL?
-
64
DATABASE NORMALIZATION
-
65
FACT & DIMENSION TABLES
-
66
PRIMARY & FOREIGN KEYS
-
67
RELATIONSHIPS VS. MERGED TABLES
-
68
THE MODEL VIEW
-
69
CREATING TABLE RELATIONSHIPS
-
70
MANAGING & EDITING RELATIONSHIPS
-
71
STAR & SNOWFLAKE SCHEMAS
-
72
ASSIGNMENT: TABLE RELATIONSHIPS
-
73
SOLUTION: TABLE RELATIONSHIPS
-
74
PRO TIP: ACTIVE & INACTIVE RELATIONSHIPS
-
75
PRO TIP: ACTIVE & INACTIVE RELATIONSHIPS
-
76
RELATIONSHIP CARDINALITY
-
77
EXAMPLE: ONE-TO-ONE CARDINALITY
-
78
EXAMPLE: MANY-TO-MANY CARDINALITY
-
79
CONNECTING MULTIPLE FACT TABLES
-
80
FILTER CONTEXT & FLOW
-
81
EXAMPLE: FILTER FLOW
-
82
BI-DIRECTIONAL FILTERS
-
83
EXAMPLE: BI-DIRECTIONAL FILTERS
-
84
AMBIGUITY
-
85
HIDING FIELDS
-
86
ASSIGNMENT: FILTER FLOW
-
87
SOLUTION: FILTER FLOW
-
88
PRO TIP: MODEL LAYOUTS
-
89
DATA FORMATS & CATEGORIES
-
90
HIERARCHIES
-
91
ASSIGNMENT: HIERARCHIES
-
92
SOLUTION: HIERARCHIES
-
93
DATA MODEL BEST PRACTICES
CALCULATED FIELDS WITH DAX
-
94
CALCULATED FIELDS WITH DAX
-
95
MEET DAX
-
96
M VS. DAX
-
97
CALCULATED COLUMNS
-
98
EXAMPLE: CALCULATED COLUMNS
-
99
DAX MEASURES
-
100
IMPLICIT VS. EXPLICIT MEASURES
-
101
QUICK MEASURES
-
102
RECAP: CALCULATED COLUMNS VS. MEASURES
-
103
PRO TIP: MEASURE TABLES
-
104
FILTER CONTEXT
-
105
EXAMPLE: FILTER CONTEXT
-
106
STEP-BY-STEP MEASURE CALCULATION
-
107
DAX SYNTAX
-
108
DAX OPERATORS
-
109
COMMON FUNCTION CATEGORIES
-
110
BASIC MATH & STATS FUNCTIONS
-
111
COUNTING FUNCTIONS
-
112
ASSIGNMENT: MATH & STATS
-
113
SOLUTION: MATH & STATS
-
114
BASIC LOGICAL FUNCTIONS
-
115
SWITCH
-
116
ASSIGNMENT: LOGICAL FUNCTIONS
-
117
SOLUTION: TEXT
-
118
BASIC DATE & TIME FUNCTIONS
-
119
ASSIGNMENT: DATE & TIME
-
120
SOLUTION: DATE & TIME
-
121
RELATED
-
122
CALCULATE
-
123
EXAMPLE: CALCULATE
-
124
EXAMPLE: CALCULATE
-
125
DAX MEASURE TOTALS
-
126
ASSIGNMENT: CALCULATE
-
127
SOLUTION: CALCULATE
-
128
SOLUTION: CALCULATE
-
129
ALL
-
130
ASSIGNMENT: CALCULATE & ALL
-
131
SOLUTION: CALCULATE & ALL
-
132
FILTER
-
133
ITERATOR FUNCTIONS
-
134
ASSIGNMENT: ITERATORS
-
135
SOLUTION: ITERATORS
-
136
TIME INTELLIGENCE
-
137
ASSIGNMENT: TIME INTELLIGENCE
-
138
SOLUTION: TIME INTELLIGENCE
-
139
DAX BEST PRACTICES
VISUALIZING DATA
-
140
VISUALIZING DATA
-
141
THREE KEY QUESTIONS
-
142
THREE KEY QUESTIONS
-
143
THREE KEY QUESTIONS
-
144
THREE KEY QUESTIONS
-
145
ANALYTICS DASHBOARDS
-
146
DASHBOARD DESIGN FRAMEWORK
-
147
THE REPORT VIEW
-
148
ASSIGNMENT: CARDS
-
149
SOLUTION: CARDS
-
150
BUILDING & FORMATTING CHARTS
-
151
BUILDING & FORMATTING CHARTS
-
152
ASSIGNMENT: LINE CHARTS
-
153
SOLUTION: LINE CHARTS
-
154
FILTERING OPTIONS
-
155
ASSIGNMENT: DONUT CHARTS
-
156
SOLUTION: DONUT CHARTS
-
157
CONDITIONAL FORMATTING
-
158
ASSIGNMENT: TABLES
-
159
SOLUTION: TABLES
-
160
ASSIGNMENT: TOP N TEXT CARDS
-
161
SOLUTION: TOP N TEXT CARDS
-
162
MAP VISUALS
-
163
SLICERS
-
164
ASSIGNMENT: SLICERS
-
165
SOLUTION: SLICERS
-
166
DRILL UP & DRILL DOWN
-
167
ASSIGNMENT: DRILL DOWN
-
168
SOLUTION: DRILL DOWN
-
169
DRILL THROUGH FILTERS
-
170
REPORT INTERACTIONS
-
171
ASSIGNMENT: REPORT INTERACTIONS
-
172
SOLUTION: REPORT INTERACTIONS
-
173
BOOKMARKS
-
174
ASSIGNMENT: BOOKMARKS
-
175
SOLUTION: BOOKMARKS
-
176
PARAMETERS
-
177
EXAMPLE: NUMERIC RANGE PARAMETER
-
178
EXAMPLE: FIELDS PARAMETER
-
179
ASSIGNMENT: FIELDS PARAMETERS
-
180
SOLUTION: FIELDS PARAMETERS
-
181
PRO TIP: CUSTOM TOOLTIPS
-
182
IMPORTING CUSTOM VISUALS
-
183
MANAGING & VIEWING ROLES
-
184
MOBILE LAYOUT
-
185
DATA VISUALIZATION BEST PRACTICES
ARTIFICIAL INTELLIGENCE
Be the first to add a review.
Please, login to leave a review
Related Courses

")
In-person
Python is a versatile and powerful programming language widely used across various industries and disciplines. Our Python course model offers a com...
₦100,000

In-person
The course model in SQL represents the structure and organization of educational courses within an academic institution. It consists of several int...
₦100,000
")
